Cargando...
Recursos educativos
-
Nivel educativo
-
Competencias
-
Tipología
-
Idioma
-
Tipo de medio
-
Tipo de actividad
-
Destinatarios
-
Tipo de audiencia
-
Creador
-
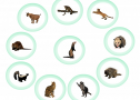
Mammals picture chart
Tiching explorer Organización
- 1 lo usan
- 1374 visitas
Interactive resource designed to help us learn vocabulary associated to mammals.
-
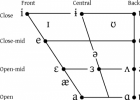
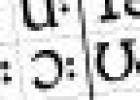
Interactive Phonemic Chart | EnglishClub SM
Francisco Cerrillo Docente
- 1 lo usan
- 2226 visitas
Click to hear each symbol and sample word. This interactive phonemic chart contains all 44 sounds used in spoken British English (Received Pronunciation).
-
Blog: Adrian’s Pron Chart Blog
Tiching explorer Organización
- 1 lo usan
- 3213 visitas
This blog is focused on pronunciation. Phonetic and phonological aspects are deeply developed in this blog.
-

Interpret. Climate chart for Madrid
EduBook Organización
- 2208 visitas
Look at the climate chart for Madrid and answer the questions. What is the average temperature in the hottest month in Madrid? And in the coldest month? In which month does it rain the most? And the least?
-

Interpret. Climate chart for Santander
EduBook Organización
- 2190 visitas
Look at the graph and answer the questions. What is the average temperature in the hottest months in Santander? And in the coldest months? In which month does it rain the most? And the least?
-

Interpret. Climate chart for Leitariegos
EduBook Organización
- 2084 visitas
Look at the graph and answer the questions: What is the average temperature in the hottest month? And in the coldest month? In which month does it rain the most? And the least?
-

Interpret. Climate chart for Malaga
EduBook Organización
- 2083 visitas
Look at the graph and answer the questions: What is the average temperature of the hottest month in Malaga? In which month does it rain the most? And the least?
-

Learn. Make a climate chart
EduBook Organización
- 1924 visitas
Make a climate chart A climate chart shows the weather conditions in a particular area over a period of time. We are going to make a climate chart with the temperatures and precipitation that are listed…
-

Causes of the French Revolution (Chart)
Anabel Sánchez Docente
- 2 lo usan
- 2738 visitas
Chart. Easy to understand!
-
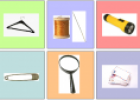
Things found in the home interactive chart
Tiching explorer Organización
- 2 lo usan
- 2515 visitas
Interactive resource designed to help us learn vocabulary associated to house objects (tape, hanger, needle and thread, nutcracker, safety pin, glass, mail, light bulb and candle).


Te estamos redirigiendo a la ficha del libro...
